In the world of ABAP development, debugging is essential and often the fastest way to identify and fix errors. While basic debugging techniques such as setting breakpoints and stepping through the code are widely known, there are advanced methods that are covered in ABAP training courses but are often forgotten in practice. They simplify troubleshooting - this is especially true for complex problems. This article presents some of these techniques.
1. use special breakpoints
In addition to the usual breakpoints, the ABAP debugger offers the option of setting special breakpoints:
- Statement breakpoints: These breakpoints are set for specific ABAP statements. For example, a statement breakpoint for the CLEAR statement stops the program every time a CLEAR statement is executed, regardless of its position in the code.
- Exception breakpoints: These breakpoints are defined for specific exceptions. The program stops the debugger as soon as this exception is triggered, regardless of whether it is handled or leads to a runtime error.
- Conditional breakpoints: A normal breakpoint can be extended to a conditional breakpoint, which only stops when a condition is met. This is particularly useful in loops, for example to only stop at certain iterations.
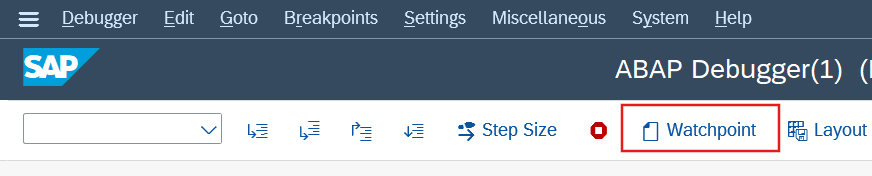
2. insert watchpoints
Watchpoints are a powerful tool for monitoring the value of variables during program execution. They make it possible to stop the program automatically as soon as the value of a certain variable is changed or reaches a certain value. This is particularly useful for identifying unexpected value changes and analyzing their cause.

3. control program sequence
The ABAP debugger offers various functions to control the control flow during debugging:
- "Step Into" (F5): Executes the next statement and steps into subroutines, methods or function modules to analyze their internal flow.
- "Step Over" (F6): Executes the next statement without entering subroutines, methods or function blocks. This is useful for continuing the process at the current level without diving into details.
- "Step Out" (F7): Ends the current procedure and returns to the calling procedure. This is helpful to quickly get out of deeply nested calls.
- "Continue" (F8): Continues program execution to the next breakpoint or to the end of the program.

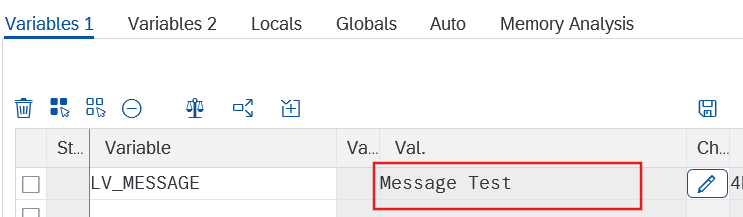
4. change values of variables
During debugging, it may be necessary to change the value of variables in order to test different scenarios or simulate certain conditions. The ABAP debugger allows you to change the values of simple variables directly. For internal tables, you can add, change or delete rows to observe the effects on the program flow.
Attention: We strongly advise against changing variables in the production system!
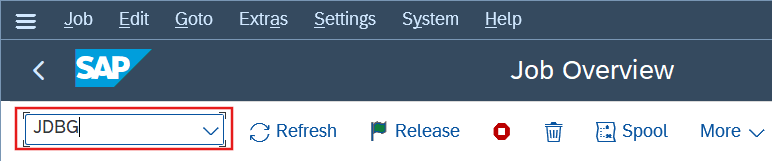
5. Debug jobs
Background jobs can also be debugged - without any complicated detours. You can use transaction SM37 to first display the job in the overview. As soon as the job is selected, simply enter "JDBG" in the command field and the debugger will start.
This causes the scenario to be run again with the same selection parameters as the original run - but this time in debug mode. An important note: The system parameter SY-BATCH is set to the value "X" in this case, which means that the debug run is still recognized as a batch run. Caution is advised, as actual database changes can also occur in debug mode (see SAP Note 573128). The job log, which provides systematic messages with MSGID and message number, and the job spool, which contains information output by the WRITE command, are helpful when analyzing the job - although the latter is often difficult to assign.

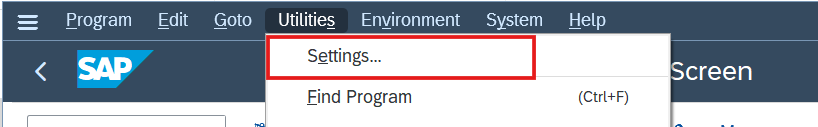
6. debugging of external requests
External calls such as RFC requests can also be examined - even if they run under a special RFC user. The first step is to clarify under which user the request is being executed. The identified user must be entered in the following debugging settings: Transaction SE80, SE38 or SE37, select "Utilities à Settings" from the menu.
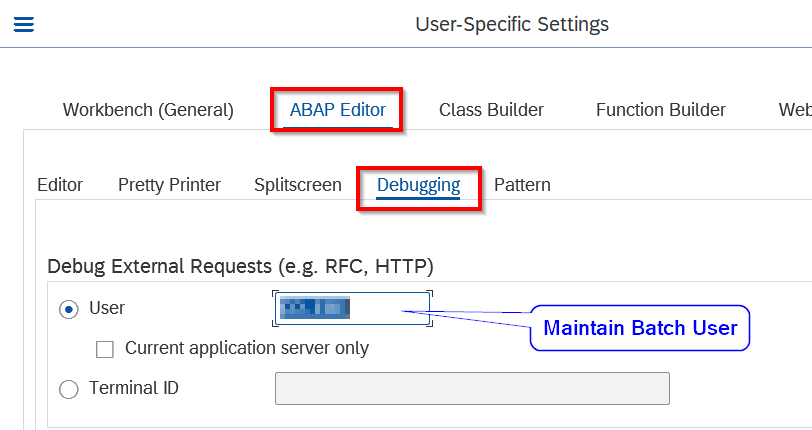
If an external breakpoint is now set in the corresponding function module, the debugging window opens automatically as soon as the request is executed. This allows you to examine these processes in a targeted manner - for example in the event of interface problems or unexpected behavior.
7. debugging of update processes
Update processes often run in the background in the SAP system - but debugging is also possible here. It is important that certain settings are activated in the debugger.
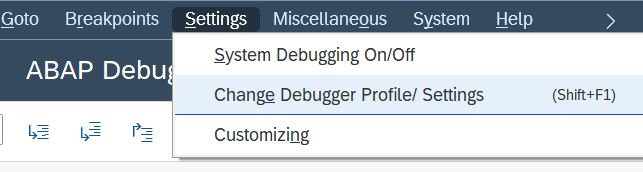
As soon as the debugger is started, open the debugger settings via the menu and check the "System debugging" and "Update debugging" boxes.
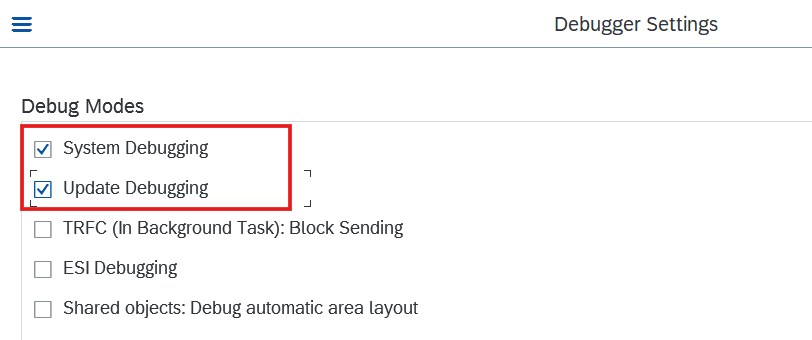
This allows you to make the otherwise "invisible" processes visible and analyze them, for example if postings are not carried out as expected or errors occur in the posting code.
Summary
The ABAP debugger offers a variety of advanced functions that go beyond basic knowledge. Through the targeted use of special breakpoints, watchpoints, control flow controls and test frameworks, developers can work more efficiently and identify and rectify complex errors more quickly. It is worth learning these techniques and using them regularly to increase the quality and stability of ABAP applications.

Many developers are familiar with the debugger - but not its full potential. Those who use its extended functions save time and discover errors where you wouldn't expect them

