A company that wants to be competitive in the age of digitalization must have transparent and coordinated processes. With the huge amounts of data being processed in companies today, it is almost impossible to keep track of the entire document flows and identify potential construction sites. In addition, sales managers or business process owners have many and complex responsibilities and cannot sift through every document. As a result, performance weaknesses such as an above-average delivery block can easily be overlooked. Yet it is precisely such weak points that provide valuable indications of a potential optimization point in the business process, which can improve the performance of the entire sales processing and make the company more competitive. SAP has recognized this and, with embedded Analytics, provides various evaluation apps that can be used for reporting purposes at no additional cost. The performance of order processing is evaluated with the help of the tile group "Order-to-Cash Monitoring".
Four apps for order fulfillment performance
Fiori Process Performance Monitoring aims to increase the transparency of order-to-cash execution. This is achieved by monitoring, identifying and resolving process issues against various KPIs by asking and evaluating the following questions by the order-to-cash manager or business process owner:
- What are the average cycle times of the processes (for example, order to delivery, goods issue to invoicing)?
- How often are delivery or billing blocks set and how long does it take to release these blocks?
- How often do critical field changes occur?
The O2C tile group includes four Fiori apps:
- Order Processing Performance - Time Series
- Order processing performance - overview
- Order processing performance - last 28 days
- Sales order fulfillment - please read our blog post on this topic.
Order processing performance - time series
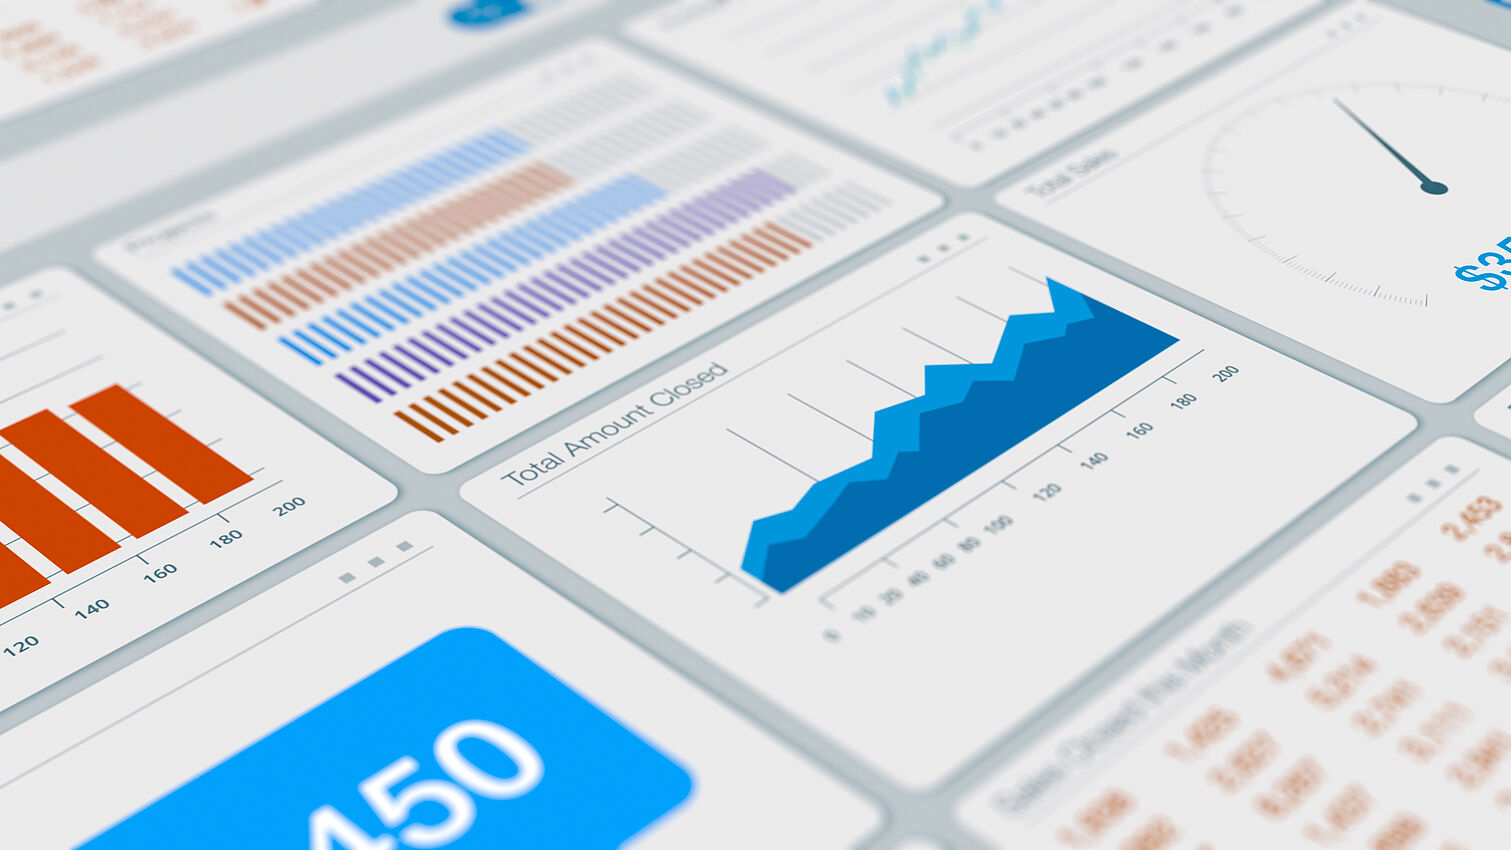
In this Fiori app, the user sees a legend of the receipts over the entire year with monthly figures. Whether posted goods issues, cancelled items or settled sales orders - dozens of KPIs are predefined and can be applied or hidden at the touch of a button. The month-by-month annual evaluation provides an overview of the order situation throughout the year and can be compared with the expected values, which reveal trends and identify slumps and particularly strong sales figures.
The overview app allows the process manager to view performance in the form of individual tiles. He can set the desired time periods for each individual tile as desired. Supporting charts and graphs show the development of the respective documents. The user can arrange the tiles as desired and hide those that are not required.

Order processing performance - overview
With the overview app, the process manager can display the performance in the form of individual tiles. The desired time periods can be set as desired for each individual tile. Supporting charts and graphs show the development of the respective documents. The user can arrange the tiles as desired and hide those that are not required.

Order processing performance - last 28 days

If the process manager needs an overview of the sales figures over the last four weeks, he uses the app "Order processing performance - last 28 days". Here, as with previous apps, the figures that are not required can be hidden with a click. In addition, the user can change the view as desired using the buttons in the bar at the top right: Whether list view, legend or bar charts - every user can work with the view he or she likes better.
Individualize analysis
In addition to the intuitive user interface, customizability is another feature that many Fiori users appreciate. The following applies to all three apps: If the necessary permissions are available, they can be customized both visually and in terms of content.
Filter area: The first filter function is located in each app directly in the upper area of the application. Here, the user can not only filter on required values such as "customer" or "currency", but also create their own multi-dimensional dashboard using the analysis path.
Filters can be set permanently and saved as a variant or redefined each time they are called up.
Charts: Almost all figures in the HANA database can be displayed in the applications as diagrams of various types. Bar charts, legends or pie charts are available to the user to get a dynamic impression of the current order processing or if documents are to be displayed in relation to each other.
Custom KPIs: Dozens of predefined KPIs can be applied for filtering purposes. If a performance figure is not included in the standard scope, own KPIs can be created.
Summary
With embedded Analytics in Fiori, the need to develop your own reports is eliminated in many places. Countless predefined apps are available for evaluation purposes. Users can adapt the apps to their needs without the need for extensive training - Fiori is intuitive to use and can be customized as required.

The FIORI tile group "Order-to-Cash Monitoring" supports process owners in maintaining an overview of the entire document flows and identifying potential weak points.

