Imagine the following situation: Shortly before your lunch break, your supervisor comes to you and wants to know the company turnover for the current year. He needs the data for an important appointment in the early afternoon. What will you do? Probably cancel your lunch break in order to find out said turnover, because extract this data from ERP takes time. In addition, you will unfortunately have to work overtime, because the day's business also has to be done. If you had an appointment during the lunch break or wanted to finish work earlier, it is even more annoying. But how about having the sales figures at your fingertips - not only for the current year, but for any period of time, per division, distributed to customers, and in a nice graphical representation? This is actually possible - with only one Fiori group "Sales Analysis".
Sales reporting in GUI: a major challenge
Unfortunately, there is no ready-to-use standard tool for analytical functions of the turnover in an ECC system. Many users either do with a query or with the various transactions, with which the self-defined information structures first had to be maintained. However, many companies use external tools to calculate sales.
Sales Turnover Visualization at the touch of a button
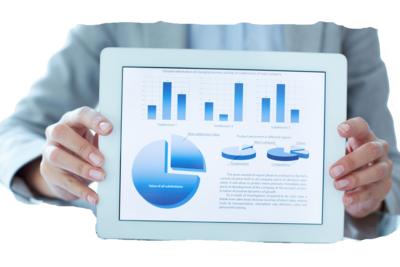
This is now changing with Fiori. It is not an exaggeration to say that sales can be accessed at the push of a button: Fiori apps access the VDM: the multi-tier Virtual Data Model is the foundation for visualization of persistent data. The virtual data model provides all necessary data collected from all business areas in real time with ABAP Core Data Service View. Whether sales for the current year, sales per customer or sales in relation to credit notes - countless standard KPIs are available and can be used for evaluation. The output of the turnover can be done in different dimensions: As a number or graphical representation in bar or pie charts.
These apps are the solution

Sales volume

The app "Sales Volume" is interactive to further processes and Analysis Apps. From here, a jump to further functional apps of the tile group "Sales - analytical functions" is given:
Profit Margin
In this app, the user gets an overview of the contribution margin according to various selection criteria, such as by client or by year. By clicking on this tile, the user performs a so-called drill-down, which provides detailed information on the key figure. This is a generic drill-down app from SAP Smart Business, meaning you can review revenue by sales organization, specific products, or customer groups to gain further insight. If you want more information, please refer to Fiori Library.


Here, too, each bar conceals further drill-down functions that provide the user with a more detailed display:
Check open Sales
This app allows you to get an overview of all open sales, including back orders, open deliveries and invoices, so that the sales manager can make a comparison with previous months to identify the problems during the O2C process and increase sales. Again, the drill-down function displays more information, which the user can filter by various parameters.
Credit Memo

With Fiori tile group "Sales Volume" it is easier than ever to determine sales and analyze them according to various aspects: The data is available at the push of a button and is supported by graphical representations.
Summary
With Fiori tile group "Sales Volume" it is easier than ever to determine sales and analyze them according to various aspects: The data is available at the push of a button and is supported by graphical representations. A deeper analysis of the data is possible directly from the respective app via drill-down function. Those who have already worked with Fiori will quickly find their way around the tile group. For those who are just getting to know Fiori, it is advisable to try out and test various functionalities of the application, because they offer many selection and analysis functions that can make the daily work of a sales employee much easier.